LabView, An Easy Introduction
LabView is a graphical programming language developed by National Instruments sometime in the mid to late 80’s by Jeff Kodosky. A program in LabView is called a VI, which stands for Virtural Instrument. To create a VI, the programmer uses the LabView programming environment to make the user interface by dragging and dropping objects, and arranging them as desired. To add functionality to the interface, the diagram, which resembles a flow chart is “wired” with the various structures and functions. So, in most LabView programs, no lines of code are written, the functionality of the program is provided by the diagram. For this reason LabView is called a graphical programming language.
Another nicety of LabView is that it closely supports a multitude of processing cards available from National Instruments. Other vendors also build cards that are LabView compatible. The cards are so tightly coupled to the LabView system that it is not uncommon to be collecting data within a few hours of receiving the data collection cards in the mail.
For these reasons, LabView has become one of the most popular data collection systems in recent years. Within the framework of Labview, user interfaces can be created, data can be collected, signals can be generated and transmitted from LabView cards, data can be analyzed and stored, etc. etc. If LabView does not provide what is needed, C code or MatLab programs can be tied to it to provide the required functionality.
In summary, LabView is a powerful graphical programming system that is compatible with a multitude of data collection cards and equipment. People use it because it is convenient and no knowledge of conventional programming languages is required.
1-1 to 1-2 , Getting Started with LabView
1-2, LabView Tutorial Manual
1, LabView, Data Acquisition & Analysis for the Movement Sciences

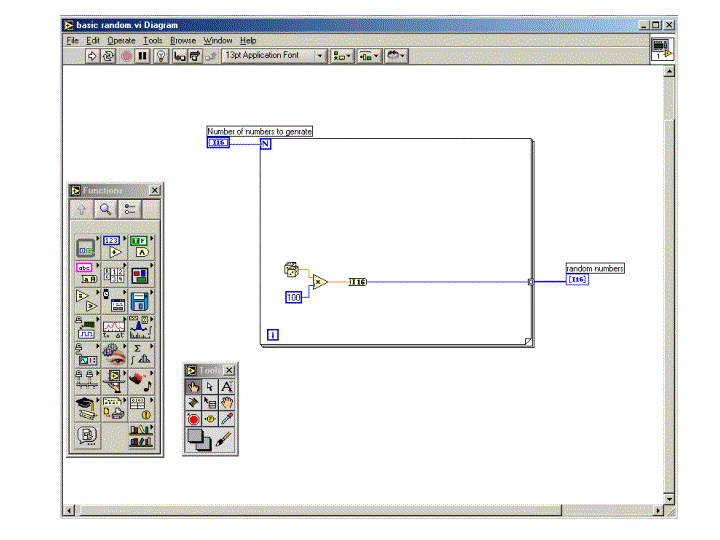
Detailed instructions for a very similar VI are given on the pages indicated below.
Page 2-4, Getting Started with LabView
Page 3-3, LabView Tutorial Manual
The best way to learn LabView is by doing it. A good place to start is by writing some programs using the basic data types. Number are pretty basic so that’s a good place to start.
First off, numbers, whether in math or in computers, come in a few different ways. For computers, we are mostly concerned with integer or real numbers. Real numbers have decimals, integers don’t.
3.14….
This is a real number because it has a decimal. If you were in algebra 2, they would say it is irrational, but since we have to estimate pi’s value, we represent it as a real number. (pi, one of my favorite foods, uh numbers)
7
This an integer. It is also the minimum number of ice creams a healthy person should eat in a week.
In LabView there are real, integer, unsigned integer, and complex numbers. There are several sizes for each. By size we mean the number of bits used to represent the number. This is nothing to worry about. When in doubt, pick I32 for integers, and double for real numbers.
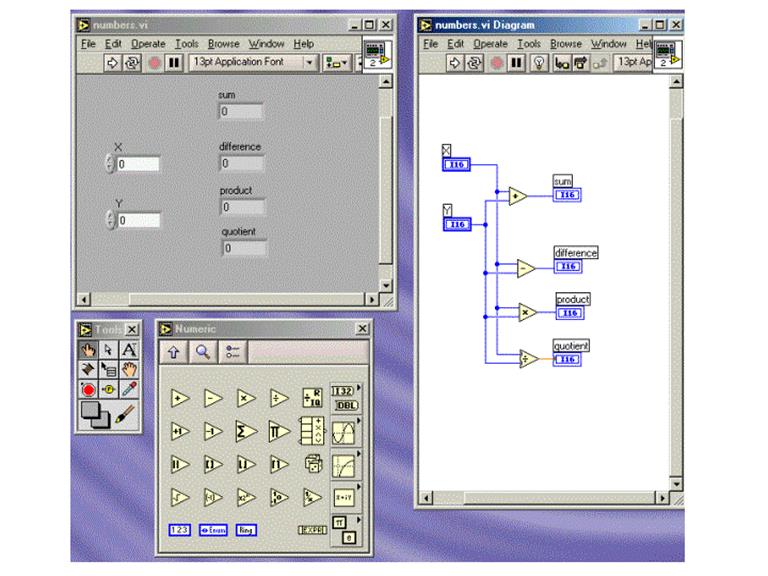
Numbers (formula)
Sometimes using the graphic operators of math operations can get hard to understand. For example, if an equation has many parts, then there could be wires going everywhere. A note of caution, while doing VI’s it is easy to understand what is being done at the moment, but when looking at complex VI’s, it can be hard to understand later. This applies doubly when looking at someone else’s work. See figure below.
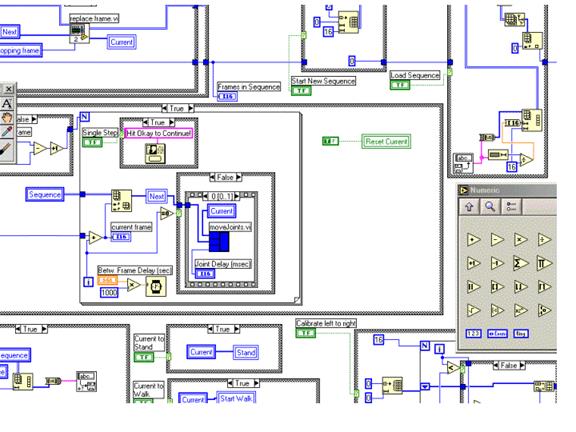
Although this looks ridiculous, what is shown is really only about 1/8th of the VI’s diagram.
Using the formula node, complex math operations can be tidied up a bit. Below the numbers formula.vi is shown along with its diagram. This program does the same thing as the numbers program, but the diagram is much different.
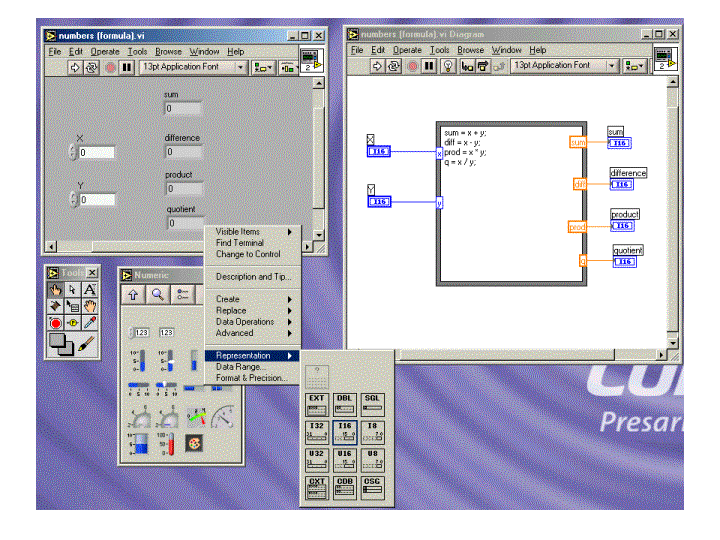
The next VI is the Boolean equivalent of number.vi. Boolean logic is a kind of logic that is usually associated with binary operations.
The basic Boolean functions are AND, OR, and NOT. The one that will be of concern immediately is NOT.
In LabView the NOT function usually has a single bit input. NOT can thought of as a function that produces the opposite of its input.
So
NOT(0) = 1
NOT(1) = 0
Usually the NOT function is used to control WHILE loops. More on that soon. Below is the basic Boolean.vi and its diagram.
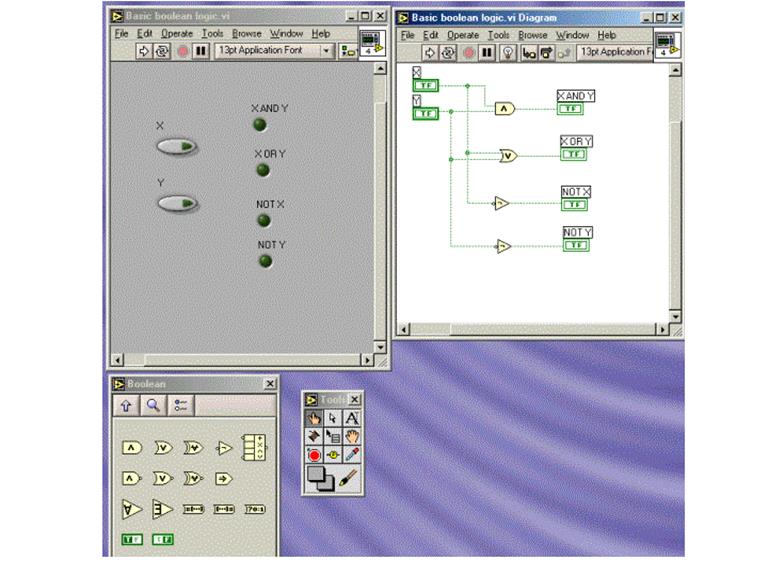
Try to make these VI’s. The diagrams will be presented in the next lecture.
Pounds = (2*Kilos)*1.1
Celsius = (F – 32) * 5/9

Heres the last one to try.
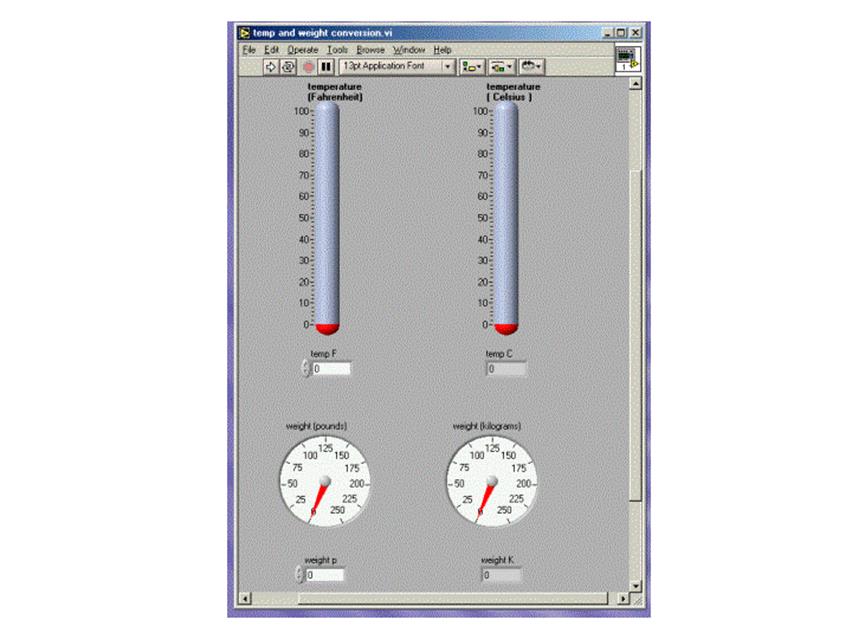
Source: https://www2.southeastern.edu/Academics/Faculty/pmcdowell/Assignment_10_LabView_Day_1_notes.doc
Web site to visit: https://www2.southeastern.edu
Author of the text: not indicated on the source document of the above text
If you are the author of the text above and you not agree to share your knowledge for teaching, research, scholarship (for fair use as indicated in the United States copyrigh low) please send us an e-mail and we will remove your text quickly. Fair use is a limitation and exception to the exclusive right granted by copyright law to the author of a creative work. In United States copyright law, fair use is a doctrine that permits limited use of copyrighted material without acquiring permission from the rights holders. Examples of fair use include commentary, search engines, criticism, news reporting, research, teaching, library archiving and scholarship. It provides for the legal, unlicensed citation or incorporation of copyrighted material in another author's work under a four-factor balancing test. (source: http://en.wikipedia.org/wiki/Fair_use)
The information of medicine and health contained in the site are of a general nature and purpose which is purely informative and for this reason may not replace in any case, the council of a doctor or a qualified entity legally to the profession.
The following texts are the property of their respective authors and we thank them for giving us the opportunity to share for free to students, teachers and users of the Web their texts will used only for illustrative educational and scientific purposes only.
All the information in our site are given for nonprofit educational purposes
The information of medicine and health contained in the site are of a general nature and purpose which is purely informative and for this reason may not replace in any case, the council of a doctor or a qualified entity legally to the profession.
www.riassuntini.com