3.1 Electrons and energy
3.1a Monitoring and measuring alternating current
Alternating current
An alternating current (a.c.) periodically changes direction. Contrast this to direct current (d.c.), which only flows in one direction. Although it is possible that current could vary in any way, we will consider a sinusoidal function, ie the voltage constantly changes in the form of a sine function. This is the most common form of a.c. since electricity generators work by spinning in circles, which means that the current is pushed one way then the other, with the instantaneous value of voltage constantly varying. Examples of each type of current when displayed on an oscilloscope are shown below.
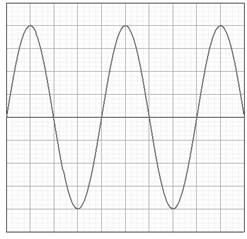
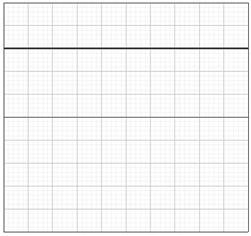
a.c. waveform d.c. waveform
An oscilloscope plots a graph of changing voltage on the y-axis versus time on the x-axis. Just like a graph we need to read the scale, except the numbers aren't along the axis, they are on a dial underneath the screen. The voltage axis scale is usually called the volts/div or volts/cm and the time axis scale is called the timebase.
To calculate the frequency of an a.c. signal, we first of all have to find its period. This is the time for one complete cycle of to and fro current, so we measure the horizontal distance on the screen between crests.
An alternating voltage varies between the same maximum negative and positive value as the voltage pushes first one way (positive) then the other (negative). This maximum is defined as the peak voltage. It can be measured from an oscilloscope by measuring the vertical distance on the screen from the bottom of the signal to the top. This then has to be halved to get the peak voltage.
Worked example
In the picture below each box on the CRO screen has a side of 1 cm.


The distance between crests is 4 cm. The distance from bottom to top is 8 cm.
The time base was set at 5 ms cm–1, The volts/div was set at 2 V cm–1,
then the period of the wave is: then the peak voltage is:
T = 4 × 5 ms = 4 × 0.005 = 0.02 s Vpeak = ½ × 8 × 2
 Vpeak = 8 V
f = 50 Hz
If the time base is switched off, the a.c. signal will not be spread along the x-axis. However, the voltage variation will continue, meaning a straight vertical line will be displayed on the screen. The height of this line from bottom to top can be processed in exactly the same way as above, ie halved then converted into voltage using the volts/div.
![]()

Alternating current – peak and rms
Electricity is a method of transferring energy, so a.c. is capable of transferring energy in the same way as d.c. The instantaneous amount of power being supplied can be calculated using the value of voltage and/or current at a particular point. However, in a.c. these values change constantly, completing 50 cycles every second in the UK. Our eye couldn’t possibly follow such quick changes. We need an average, but the average value of the voltage during any complete cycle is zero!
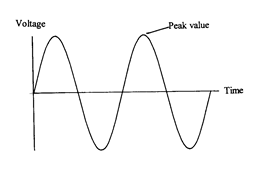
The amount of energy transmitted by a.c. will depend on some ‘average’ value of the voltage, but as we have seen above the average value is zero! A different ‘average’ must be used. The ‘average’ value of an a.c. voltage is called the root mean square (rms) voltage (Vrms).
The definition of the rms voltage is that it is that value of direct voltage that produces the same power (eg heating or lighting) as the alternating voltage. The rms value is what is quoted on a power supply so that a fair comparison between a.c. and d.c. can be made, eg a 6 V battery will produce the same brightness of light bulb as a 6 V rms a.c. supply. The rms current has a similar definition.
Consider the following two circuits, which contain identical lamps.
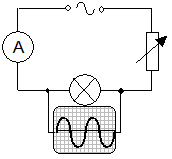
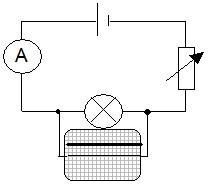
The variable resistors are altered until the lamps are of equal brightness. As a result the d.c. has the same value as the effective a.c. (ie the lamps have the same power output). Both voltages are measured using an oscilloscope, giving the voltage equation below. Also, since V = IR applies to the rms valves and to the peak values, a similar equation for currents can be deduced.

Note: A multimeter switched to a.c. mode will display rms values.
Graphical method to derive the relationship between peak and rms values of alternating current
The power produced by a current I in a resistor of resistance R is given by I2R. A graph of I2 against t for an alternating current is shown below. A similar method can be used for voltage.

The average value of ![]() is
is ![]() and therefore the average power supplied is
and therefore the average power supplied is![]() .
.
An identical heating effect (power output) for a d.c. supply is Irms2R (since Irms is defined as the value of d.c. current that will supply equivalent power).
Setting both of these equal to each other gives:
![]()
![]()
![]()
Important notes:
1. Readings on meters that measure a.c. are rms values, not peak values.
2. For power calculations involving a.c. always use rms values:
![]()
3. The mains supply is usually quoted as 230 V a.c. This is of course 230 V rms. The peak voltage rises to approximately 325 V. Insulation must be provided to withstand this peak voltage.
Example
A transformer is labelled with a primary of 230 Vrms and secondary of 12 Vrms. What is the peak voltage which would occur in the secondary?
Vpeak = Ö 2 × Vrms
Vpeak = 1.41 × 12
Vpeak = 17.0 V
3.1b Current, voltage, power and resistance
Basic definitions
In the circuit below, when S is closed the free electrons in the conductor experience a force that causes them to move. Electrons will tend to drift away from the negatively charged end towards the positively charged end.

Current is a flow of electrons and is given by the flow of charge (coulombs) per second:
![]()
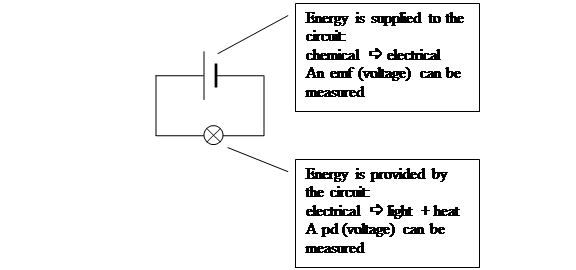
The energy required to drive the electron current around this circuit is provided by a chemical reaction in the battery. The electrical energy that is supplied by the source is transformed into other forms of energy in the components that make up the circuit.
Voltage is defined as the energy transferred per unit charge.
V = W/Q
In this section W will be used for the work done, ie energy transferred, therefore 1 volt = 1 joule per coulomb (J C–1).
When energy is being transferred from an external source to the circuit, the voltage is referred to as an electromotive force (emf). When energy is transformed into another form of energy by a component in the circuit, the voltage is referred to as a potential difference (pd).

Sources of emf
Emfs can be generated in a great variety of ways. See the table below for examples.
Chemical cell |
Chemical energy drives the current |
Thermocouple |
Heat energy drives the current |
Piezo-electric generator |
Mechanical vibrations drive the current |
Solar cell |
Light energy drives the current |
Electromagnetic generator |
Changes in magnetic field drive the current |
Ohm’s law
In any circuit, providing the resistance of a component remains constant, if the potential difference V across the component increases, the current I through the component will increase in direct proportion.
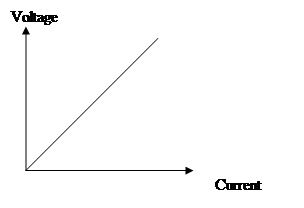 At a fixed temperature, for a given conductor:
V ![]() I, ie V/I is constant
I, ie V/I is constant
The constant of proportion is defined to be the resistance,
ie ![]() or
or ![]()
This is Ohm’s law.
A component that has a constant resistance when the current through it is increased is said to be ohmic. Some components do not have a constant resistance; their resistance changes as the pd across the component is altered, for
example a light bulb, a transistor or a diode. A graph of V versus I for such components will not be a straight line.
Electric power
For a given component P = IV since:
![]()
Since V = IR
P = I × IR (substituting for V)
= I2R
or 
![]()
so ![]()
The expression I2R gives the energy transferred in one second due to resistive heating. Apart from obvious uses in electric fires, cookers, toasters etc, consideration has to be given to heating effects in resistors, transistors and integrated circuits, and care taken not to exceed the maximum ratings for such components. The expression V2/R is particularly useful when the voltage of a power supply is fixed and you are considering changes in resistance, eg different power of heating elements.
Example
An electric heater has two heating elements allowing three settings: low, medium and high. Show by calculation which element(s) would be switched on to provide each power setting.


for 30 Ω: ![]() = 1800 W → low power
= 1800 W → low power
for 15 Ω: ![]() = 3500 W → medium power
= 3500 W → medium power
for both:

Rp = 10 Ω
![]() = 5300 W → high power
= 5300 W → high power
|
Series |
Parallel |
Current |
|
|
Voltage |
|
|
Resistance |
|
|
Addition of power
By conservation of energy, the total power used in both series and parallel circuits is the sum of the power used in each component.
Useful to remember
 Identical resistors in parallel
Two resistors of the same value (R) wired in parallel:
RP = half the value of one of them (½R).
eg 2 × 1000 Ω in parallel, RP = 500 Ω
2 × 250 Ω in parallel, RP = 125 Ω
Voltage and current by proportion
The voltage across an individual resistor in a series circuit is proportional to the resistance. The current through one of two resistors in parallel is inversely proportional to the resistance, ie proportional to the other resistance.
Examples
Current in parallel Voltage in series


3A will split in the ratio: RS = 8 + 4 + 12 = 24 Ω
![]()
![]()
![]() 3 A = 1 A
3 A = 1 A ![]()
![]() 3 A = 2 A
3 A = 2 A ![]()
The smallest resistor takes the largest current, so:
I1 = 2 A, I2 = 1 A
Worked example 1
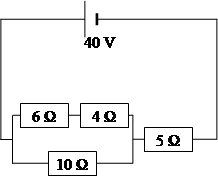
In the circuit shown opposite calculate:
(a) the current in each resistor
(b) the pd across each resistor
(c) the power dissipated in each resistor.
(a) 4 Ω and 6 Ω in series are equivalent to 10 Ω so the resistor network can be represented as:
![]()
RP = 5 Ω
RT = 5 + 5 = 10 Ω
![]() 4 A (current through 5 Ω)
4 A (current through 5 Ω)
I1 meets a resistance of 10 Ω and so does I2.
so I1 = I2 = 2 A
(b) For the 5 Ω resistor: V = IR = 4 × 5 = 20 V
for the 4 Ω resistor: V = IR = 2 × 4 = 8 V
for the 6 Ω resistor: V = IR = 2 × 6 = 12 V
for the 10 Ω resistor: V = IR = 2 × 10 = 20 V
(c) For 5 Ω: P = IV = 20 × 4 = 80 W
for 4 Ω: P = I2R = 22 × 4 = 16 W
for 6 Ω: ![]()
![]() 24 W
24 W
for 10 Ω: P = VI = 20 × 2 = 40 W
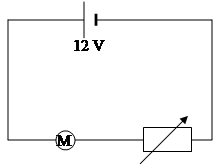 A 10 W model car motor operates on a
12 V supply. In order to slow the car
it is connected in series with a controller
(rheostat).
The controller is adjusted to reduce the motor’s power to 4 W.
Assuming that the resistance of the motor does not change, calculate:
(a) the resistance of the controller at this setting
(b) the power wasted in the controller.
(a) We cannot find the resistance of the controller directly. We need to find the resistance of the motor and the total resistance of the circuit when the motor is operating at 10 W.
For the motor at 10 W, P = 10 W, V = 12 V
![]() , so
, so ![]()
R = 14.4 Ω
For the motor at 4 W, P = I2R, so I = ![]()
= 0.527 A
For the whole circuit: ![]() 22.8 Ω
22.8 Ω
Resistance of controller = 22.8 – 14.4 = 8.4 Ω
(b) Power in controller = I2R = 0.5272 × 8.4
= 2.3 W
The potential divider
A potential divider provides a convenient way of obtaining a variable voltage from a fixed voltage supply.
Consider first two fixed resistors, R1 = 10 Ω and R2 = 20 Ω, connected in series across a 6 V supply:


The current in this circuit can be calculated using Ohm’s law (total R = 10 + 20 = 30 Ω).
so, ![]()
= 0.2 A
The voltage across R1 V1 = IR1 = 0.2 × 10
= 2 V
The voltage across R2 V2 = IR2 = 0.2 × 20
= 4 V
If you look closely you can see that the voltages across the resistors are in the ratio of their resistances (½ in this case),
ie, ![]()
The voltage across R1 is given by:
![]()
similarly, the voltage across R2 is
![]()
This is known as the potential divider rule.
A variable resistor connected as shown below provides another way of changing the ratio R1/R2. The resistance between A and W represents R1 and that between W and B represents R2.
A variable voltage (eg from 0 to 6 V in the example shown below) is available between A and W as the wiper (or slider) is rotated. For example, it will be 3 V when the wiper is halfway round the track.
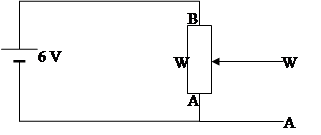
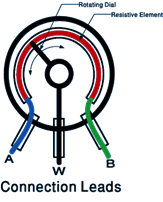
Note that the above only holds true as long as the load connected across AW has a very high resistance. If it has a resistance comparable with that of AW the
situation becomes more complicated. The effective resistance at the output must then be calculated before the potential divider rule is applied.
Worked example
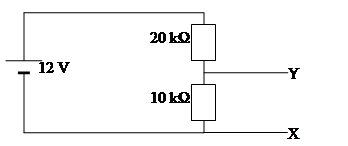

(a) Calculate the voltage across XY.
R1 = 10 kΩ
R2 = 20 kΩ
VS = 12 V
V1 = ?
![]()
![]()
V1 = 4 V
(b) The circuit attached to XY has a resistance of 10 kΩ. Calculate the effective resistance between XY and thus the voltage across XY.
The resistance between XY comes from the two identical 10 kΩ resistors in parallel. The combined resistance is therefore 5 kΩ. Use this resistance as R1 in the potential divider formula.
R1 = 5 kΩ
R2 = 20 kΩ
VS = 12 V
V1 = ?
![]()
![]()
V1 = 2.4 V
3.1c Electrical sources and internal resistance
Up to this stage in your study of physics we have assumed that power supplies are ideal. This means that their voltage remains constant and they can supply any current we wish if we connect the correct resistance. In most cases these are good assumptions, but if you take a small battery and connect bulbs one after another in parallel you will notice that eventually their brightness dims. A similar effect can be noticed if you start a car with the headlights on. Both these situations have one thing in common: they involve significant current being supplied by the battery. If you are able to touch the battery you may notice it getting warm when in use. This is a wasted transfer of energy and can be modelled by considering that the battery, like all conductors, has some resistance of its own. This model explains why some of the chemical energy converted is dissipated as heat and is not available to the circuit – resistors convert electrical energy to heat energy. We say that the power supply has an internal resistance, r. In most cases this is so small (a few ohms) that it can be considered negligible. However, when the current in the circuit is large, meaning the external resistance is small, its effects can be significant. In the past we have assumed that any cell could deliver an unlimited current, but clearly this is not the case. The greater the current the more energy will be dissipated in the power supply until eventually all the available energy (the emf) is wasted and none is available outside the power supply.
Energy will be wasted in getting the charge through the supply (this energy appears as heat) and so the energy per unit charge available at the output (the terminal potential difference or tpd) will fall. There will be ‘lost volts’. The lost volts = Ir.
Note: A common confusion is that Ir stands for internal resistance. r is the symbol for internal resistance and Ir is the value of the lost volts.
The fact that a power supply has an internal resistance is not a very difficult problem to deal with because we can represent a real supply as:
real cell = ideal cell + a resistance r


Special case – open circuit (I = 0)
We now need to consider how we can measure the key quantities. Firstly, it would be very useful to know the voltage of the ideal cell. This is called the emf of the cell, which was defined previously as the energy (eg chemical energy) supplied per unit of charge. It is found by finding the voltage across the cell on ‘open circuit’, ie when it is delivering no current. This can be done in practice by using a voltmeter or oscilloscope.
Why should this be so? Look at this diagram:

Since I = 0
V across r = I × r = 0 × r
= 0
So no voltage is dropped across the internal resistance and a voltmeter across the real cell would register the voltage of the ideal cell, the emf.
Under load
When a real cell is delivering current in a circuit we say that it is under load and the external resistance is referred to as the load.
Consider the case of a cell with an internal resistance of 0.6 Ω delivering current to an external resistance of 11.4 Ω:

Cell emf. = 6 V
I = 0.5 A
The voltage measured across the terminals of the cell will be the voltage across the 11.4 Ω resistor, ie,
V = IR = 0.5 × 11.4
= 5.7 V
and the voltage across the internal resistance:
V = Ir = 0.5 × 0.6
= 0.3 V
so the voltage across the terminals is only 5.7 V (this is the terminal potential difference, or tpd) and this happens because of the voltage dropped across the internal resistance (0.3 V in this case). This is called the lost volts.
If Ohm’s law is applied to a circuit containing a battery of emf E and internal resistance r with an external load resistance R:
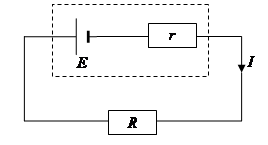

and if I is the current in the circuit and V is the pd across R (the tpd.), then using conservation of energy:
emf = tpd + lost volts
E = V across R + V across r
and: E = V + Ir
This is the internal resistance equation, which can clearly be rearranged into different forms, for example:
V = E – Ir
or, since V = IR,
E = IR + Ir
ie E = I(R + r)
Special case – short circuit (R = 0)
The maximum current is the short-circuit current. This is the current that will flow when the terminals of the supply are joined with a short piece of thick wire (ie there is no external resistance).
By substituting R = 0 in the above equation we get:
E = I(0 + r)
ie E = Ir
Measuring E and r by a graphical method
When we increase the current in a circuit the tpd will decrease. We can use a graph to measure the emf and internal resistance. If we plot V on the y-axis and I on the x-axis, we get a straight line of negative gradient. From above:
V = E – Ir
V = (–r) × I + E
Comparing with the equation of a straight line
y = mx + c
we can see that the gradient of the line (m) is equivalent to –r and the y-intercept (c) is E.


This graph can also be modified to show that the external resistance (R) and internal resistance (r) act as a potential divider. As R decreases then lost volts must increase.
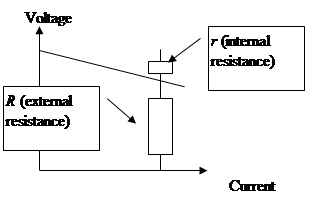

We can then use the potential divider relationships:
emf = tpd + lost volts
![]()
![]()
![]()
Second graphical method
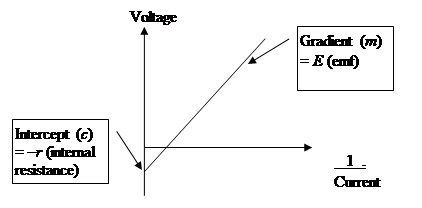
When we change the external resistance (R) in a circuit, there will be a corresponding change in the current flowing. If we plot R on the y-axis and 1/I on the x-axis, we get a straight line of positive gradient and negative intercept. From above:
E = IR + Ir
Divide both sides by I:
E/I = R + r
R = (E × 1/I) – r
Comparing with the equation of a straight line:
y = mx + c
we can see that the gradient of the line (m) is equivalent to E and the y-intercept (c) is –r.

Worked example
A cell of emf 1.5 V is connected in series with a 28 Ω resistor. A voltmeter measures the voltage across the cell as 1.4 V.
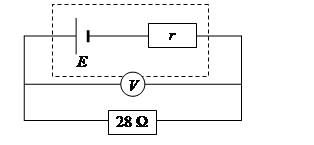

Calculate:
(a) the internal resistance of the cell
(b) the current if the cell terminals are short circuited
(c) the lost volts if the external resistance R is increased to 58 Ω.
(a) E = V + Ir
In this case we do not know the current, I, but we do know that the voltage across the 28 Ω resistor is 1.4 V, and I = V/R , so I = 0.05 A.
1.5 = 1.4 + 0.05r
![]() 2 Ω
2 Ω
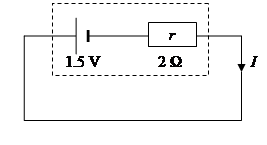 (b) Short circuit:
Total resistance = 2 Ω
![]() 0.75 A
0.75 A
(c) E = I(R + r)
1.5 = I(58 + 2)
I = 1.5/60 = 0.025 A
lost volts = Ir
= 0.025 × 2 = 0.05 V
3.1d Capacitors
Capacitance is the ability (or capacity) to store charge. A device that stores charge is called a capacitor.
Practical capacitors are conductors separated by an insulator. The simplest type consists of two metal plates with an air gap between them. The symbol for a capacitor is based on this:

![]()
Relationship between charge and pd
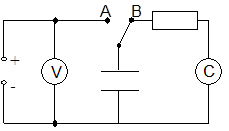 The capacitor is charged to a chosen voltage by setting the switch to A. The charge stored can be measured directly by discharging through the coulometer with the switch set to B. In this way pairs of readings of voltage and charge are obtained.
It is found that the charge stored on a capacitor and the pd (voltage) across it are directly proportional:

so Q = a constant
V
This constant is defined as the capacitance, C:
![]() or Q = CV
or Q = CV
The formal definition of capacitance is therefore the charge stored per unit voltage. Notice that this means that capacitance is the gradient of the above graph. The unit of capacitance is the farad (F).
From the above formula: 1 F = 1 coulomb per volt.
The farad is too large a unit for practical purposes and the following submultiples are used:
1 mF (microfarad) = 1 × 10⁻⁶ F
1 nF (nanofarad) = 1 × 10⁻⁹ F
Note: When a capacitor is charging, the current is not constant (more on this later). This means the formula Q = It cannot be used to work out the charge stored.
Worked example
A capacitor stores 4 × 10⁻⁴ C of charge when the potential difference across it is 100 V. Calculate the capacitance.
![]() F (4 mF)
F (4 mF)
Energy stored in a capacitor
Why work must be done to charge a capacitor
Consider this:
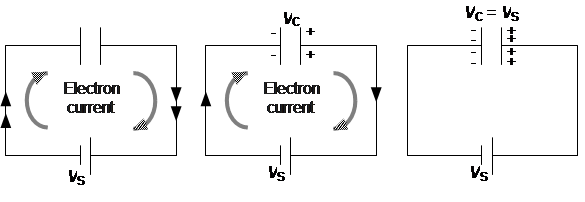

When current is switched on electrons flow onto one plate of the capacitor and away from the other plate. |
This results in one plate becoming negatively charged and the other plate positively charged. |
Eventually the current ceases to flow. This happens when the pd across the plates of the capacitor is equal to the supply voltage. |
The negatively charged plate will tend to repel the electrons approaching it. In order to overcome this repulsion work has to be done and energy supplied. This energy is supplied by the battery. Note that current does not flow through the capacitor, electrons flow onto one plate and away from the other plate.
For a given capacitor the pd across the plates is directly proportional to the charge stored. Consider a capacitor being charged to a pd of V and holding a charge Q.

This work is stored as electrical energy, so:
E = ½QV
(Contrast this with the work done moving a charge in an electric field where W = QV. In a capacitor the amount of charge and voltage are constantly changing rather than fixed and therefore the ½ is needed as an averaging factor.)
Since Q = CV there are alternative forms of this relationship:
energy = ½CV2
and energy = ½![]()
Worked example
A 40 mF capacitor is fully charged using a 50 V supply. Calculate the energy stored in the capacitor.
energy = ½CV2
= ½ × 40 × 10–6 × 502
= 0.05 J
Charging and discharging a capacitor
Charging
Consider the following circuit:

When the switch is closed the current flowing in the circuit and the voltage across the capacitor behave as shown in the graphs below.


Consider the circuit at three different times.
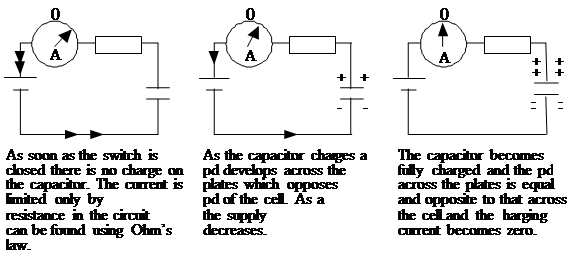

Discharging
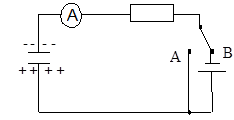
Consider the circuit opposite in which
the capacitor is fully charged:
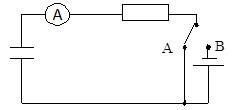
If the cell is shorted out of the circuit
the capacitor will discharge.
While the capacitor is discharging, the current in the circuit and the voltage across the capacitor behave as shown in the graphs below:
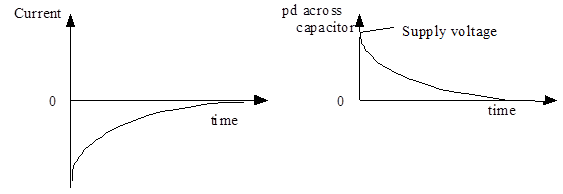
Although the current/time graph has the same shape as that during charging, the currents in each case are flowing in opposite directions. The discharging current decreases because the pd across the plates decreases as charge leaves them.
A capacitor stores charge, but unlike a cell it has no capability to supply more energy. When it discharges, the energy stored will be used in the circuit, eg in the above circuit it would be dissipated as heat in the resistor.
Factors affecting the rate of charge and discharge
The time taken for a capacitor to charge is controlled by the resistance of the resistor R (because it controls the size of the current, ie the charge flow rate) and the capacitance of the capacitor (since a larger capacitor will take longer to fill and empty). As an analogy, consider charging a capacitor as being like filling a
jug with water. The size of the jug is like the capacitance and the resistor is like the tap you use to control the rate of flow.
The values of R and C can be multiplied together to form what is known as the time constant. Can you prove that R × C has units of time, seconds? The time taken for the capacitor to charge or discharge is related to the time constant.
Large capacitance and large resistance both increase the charge or discharge time.
The I/t graphs for capacitors of different value during charging are shown below:
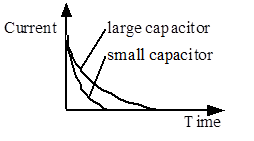
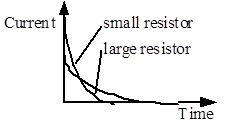
The effect of capacitance on charge The effect of resistance on charge
current current
Note that since the area under the I/t graph is equal to charge, for a given capacitor the area under the graphs must be equal.
Worked example
The switch in the following circuit is closed at time t = 0.
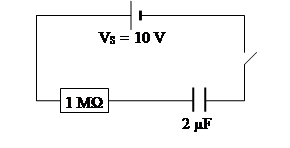

(a) Immediately after closing the switch what is
(i) the charge on C?
(ii) the pd across C?
(iii) the pd across R?
(iv) the current through R?
(b) When the capacitor is fully charged what is
(i) the pd across the capacitor?
(ii) the charge stored?
(a) (i) The initial charge on the capacitor is zero.
(ii) The initial pd across the capacitor is zero since there is no charge.
(iii) pd across the resistor is 10 V
(VR = VS – VC = 10 – 0 = 10 V)
(iv) ![]() 1 × 10⁻⁵ A
1 × 10⁻⁵ A
(b) (i) Final pd across the capacitor equals the supply voltage, 10 V.
(ii) Q = VC = 2 × 10–6 × 10 = 2 × 10⁻⁵ C
© Learning and Teaching Scotland 2011
Source: http://www.kgsorkney.com/uploads/1/4/9/3/14935550/3._1_electrons_and_energy_tcm4-665533.doc
Web site to visit: http://www.kgsorkney.com
Author of the text: indicated on the source document of the above text
If you are the author of the text above and you not agree to share your knowledge for teaching, research, scholarship (for fair use as indicated in the United States copyrigh low) please send us an e-mail and we will remove your text quickly. Fair use is a limitation and exception to the exclusive right granted by copyright law to the author of a creative work. In United States copyright law, fair use is a doctrine that permits limited use of copyrighted material without acquiring permission from the rights holders. Examples of fair use include commentary, search engines, criticism, news reporting, research, teaching, library archiving and scholarship. It provides for the legal, unlicensed citation or incorporation of copyrighted material in another author's work under a four-factor balancing test. (source: http://en.wikipedia.org/wiki/Fair_use)
The information of medicine and health contained in the site are of a general nature and purpose which is purely informative and for this reason may not replace in any case, the council of a doctor or a qualified entity legally to the profession.
The following texts are the property of their respective authors and we thank them for giving us the opportunity to share for free to students, teachers and users of the Web their texts will used only for illustrative educational and scientific purposes only.
All the information in our site are given for nonprofit educational purposes
The information of medicine and health contained in the site are of a general nature and purpose which is purely informative and for this reason may not replace in any case, the council of a doctor or a qualified entity legally to the profession.
www.riassuntini.com